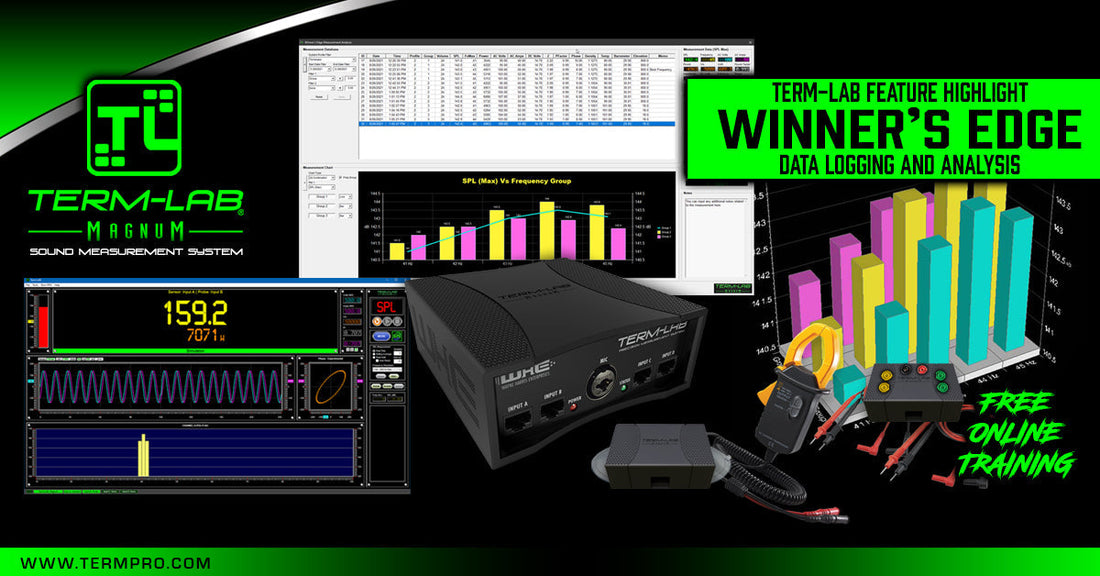
Maximize Your Score: A Guide to the Winner's Edge Analysis Module for Term-LAB SPL Meter
The Winner's Edge logging and analysis module is a free subscription benefit for Term-LAB Magnum/Rebel customers with an active maintenance plan. If your software maintenance has lapsed, please click HERE to renew.
Winner's Edge allows you to save measurements for test purposes. You can then analyze these measurements to identify problems and make adjustments to maximize your score.
Winner's Edge Features Include
- Supports multiple vehicle profiles
- More than 100 measured and/or calculated values are stored when you save a measurement.
- Flexible filters help you focus on only those measurements that meet specific criteria.
- An integrated chart allows you to compare up to 4 different measurement parameters at once.
- Current weather conditions may be saved with each measurement.
- Winner's Edge will calculate the actual air density for the entered values.
- Frequency Grouping can be used to compare performance between differing measurement conditions.
Instructions
Note: Winner's Edge requires a current software maintenance subscription and is only accessible while in the "SPL" measurement mode.
1. Create a System Profile
Profiles are used to describe the vehicle and the installation. Most users will only need to create a single profile. If you are a member of a team, or if you have multiple vehicles, you should create a profile for each vehicle that will be tested. Also, if you significantly change your sound system (amps, subs, enclosures, electrical system, etc.), you should create a new profile for the new system. When you analyze your results the software provides you with the ability to filter by profile.
To create a profile do the following...
- Select "Tools / Winner's Edge Profile Manager" from the Term-LAB pull-down menu.
- Click on "New Profile"
- Enter the vehicle specific profile information

2. Perform a Measurement.
- Select the "SPL" judging mode
- Select the "Peak Hold" measurement mode

- Perform a normal SPL measurement and then click the Stop button.
- Click on the "Save" button.

- The Save Measurement window will open.

Be sure to enter all relevant information including the volume control setting that was used and the current "Environmental" conditions. (There are many free Apps that can provide you with the environmental data.) Make sure the data you use is for your specific geographic location. (A thermometer should be used to get the exact temperature. Your phone can provide exact, GPS referenced elevation. The barometric pressure can be obtained from a weather app.)
Click "Save" to save the measurement. All of the measured and calculated values (100+) will be saved to the database.
3. Measurement Analysis
The Winner's Edge analysis features provide you with powerful capabilities for analyzing measurement data.
- Select "Tools / Winner's Edge Measurement Analysis" from the Term-LAB pull-down menu. The Winner's Edge Analysis window will open.

The top portion of the analysis window will depict a table of existing measurements (from the database). The bottom portion of the window includes a chart that is used to visually depict the desired measurement data. The right portion of the analysis window displays specific details about the currently selected measurement.
Measurement Database Filters

This group of controls are used to filter the measurement data. The measurement table will then display the filtered results. Configure the filters as desired and then click on the "Apply" button.
Measurement Table
The measurement table depicts the filtered measurements. To view the specific details for a measurement, simply click on the row of interest. The corresponding measurement data will be displayed in the right-hand column (Measurement Data).
Measurement Detail
Term-LAB records and/or calculates a significant amount of data. The Measurement Data window includes a drop-down list that is used to group specific measurement values together.

For example, when "SPL Max" is selected, all of the digital readouts will show the measurement values that existed when the maximum SPL was achieved.
Measurement Chart
The measurement chart is used to visually display the filtered measurement data shown in the measurement table. The chart is capable of displaying up to 4 different measurement parameters at the same time.
Plot Controls

- Select the desired measurement parameter to plot in the "Plot 1" drop-down list. For example, select "SPL (max)". The chart will be updated to visually depict the filtered measurement data.
- To add a second plot, select the next desired measurement parameter in the "Plot 2" drop-down list. For example, select "Power (SPL Max)". The chart will be updated to visually depict the addition of this measurement parameter.
- Plots 3 and 4 may also be selected as desired. Since the chart only has 2 Y-Axis (left and right), plots 3 and 4 must be the same type of measurement data as either plots 1 or 2.
Additional Features
- The tall buttons to the left of the measurement filters and to the left of the measurement chart plot controls are used to show/hide the filter controls and/or plot controls.
- The "Table" button on the toolbar is used to show/hide the measurement table.
- The "Chart" button on the toolbar is used to show/hide the measurement chart.
- The "Configuration" button on the toolbar is used to configure Winner's Edge
- Database backup and restore
- Export measurement data to a CSV text file
Important: If you perform a lot of measurements, you should routinely backup your measurement database. To do this simply click on the "Backup" button on the toolbar. We recommend that you save the backup to a thumb drive.
Winner's Edge calculates "Air Density" from the supplied environmental data. Air density is based on barometric pressure, elevation, temperature, and atmospheric water vapor. This calculated value provides powerful capabilities for serious competitors.
Frequency Groups (Advanced)
Winner's Edge incorporates a powerful "Group" feature that can be used to group specific types of measurements together.
Frequency Group Strategy
Identify your best frequency for use in competition. For example, if you typically use 43 Hz to compete, this will be the frequency you use as a reference.
Each time you visit a new geographic location, or encounter different environmental conditions, you should take 5 measurements. It is important that you use the SAME volume control setting for each measurement. The measurements do not need to be at maximum SPL but they should be at least within 3 to 6 dB of this number.
Example: You normally play 43 Hz at volume control setting 27 to achieve your maximum SPL. For test purposes you will use volume control setting 24 (which results in a 3 dB drop in SPL on your system.)
Please take (and save) the following 5 measurements...
- 41 Hz at volume setting 24 (Enter a "Group" number in the "Save Measurement" screen. For this example, enter "1" for the Group.)
- 42 Hz at volume setting 24 (Group 1)
- 43 Hz at volume setting 24 (Group 1)
- 44 Hz at volume setting 24 (Group 1)
- 45 Hz at volume setting 24 (Group 1)
You have now completed 5 measurements that straddle your normal competition frequency.
Repeat these steps the NEXT time you go to a new location or encounter different condition. However, use a DIFFERENT group number. Every group should have its own unique group number.
Note: The following images are comprised of 3 groups. Each group consists of 5 measurements as described above.
Frequency Group Analysis
- Select "Group" for "Filter 1"
- Change the "=" sign to ">"
- Enter "0" for the filter value.
- Click on the "Apply" button
The Measurement Table will now display all of the measurements that have a Group value that is greater than 0.
The image above depicts the SPL values for all of the measurements shown in the database table (filtered by group).
Select "Power (SPL Max)" for "Plot 2" and then change the Plot 1 type to "Line" and the Plot 2 type to "Bar". These settings will now depict a chart that includes both the SPL and Power values for all of the measurement values shown in the measurement table.
The real power of the "Frequency Grouping" strategy is apparent when you select the "Freq Group" checkbox (adjacent to the plot controls.)

Note: The "Freq Group" checkbox is only available when the "Group" filter is active.


The image above depicts SPL vs Frequency for each of the three groups in the example. Notice the frequencies (41 Hz - 45 Hz) on the X-Axis.
You can also view the chart in 3D. Simply change the "Chart Type" in the plot control section to "3d Combination".

The powerful new logging and analysis features offered by Winner's Edge, including air density calculations and frequency grouping, provide serious contestants with the features and capabilities necessary to maximize the performance of their system.